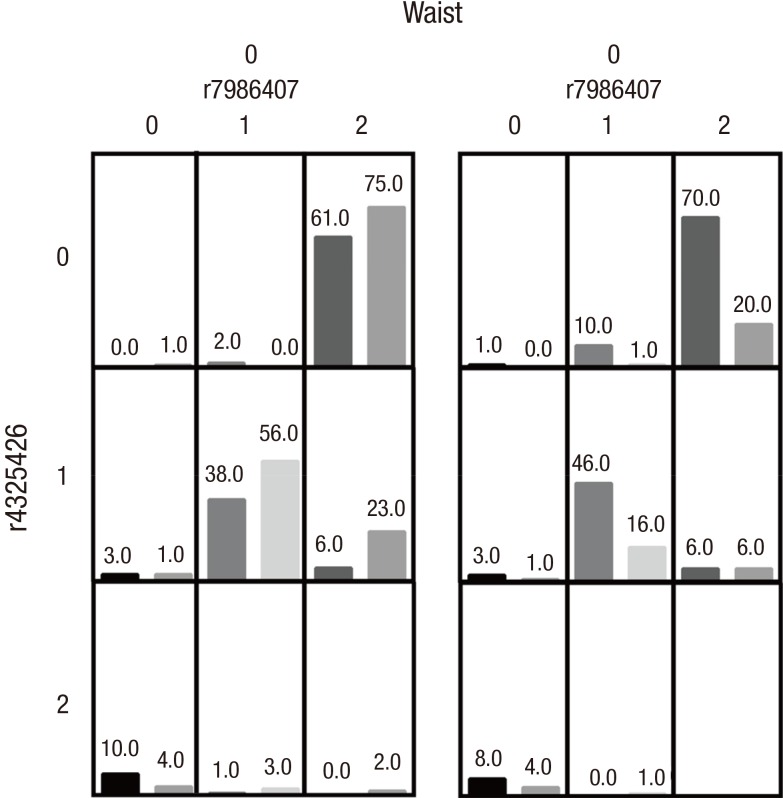
Fig. 2.
Distribution of high-risk and low-risk genotypes in the best 3-factor model.
High-risk genotypes are in dark gray and low-risk genotypes are in light gray. The number of T2DM patients (left bar in boxes) and control subjects (right bar in boxes) are shown for each 3-factor combination. rs7986407: 0 for AA genotype, 1 for AG genotype, 2 for GG genotype; rs4325426: 0 for AA genotype, 1 for AC genotype, 2 for CC genotype; Age: 0 for ≤ 40 years, 1 for > 40 years and ≤ 60 years, 2 for > 60 years; BMI: 0 for < 25 kg/m2, 1 for ≥ 25 kg/m2; Waist: 0 for < 90 cm (male) or 80 cm (female), 1 for ≥ 90 cm (male) or 80 cm (female); TG: 0 for < 1.7 mmol/L, 1 for ≥ 1.7 mmol/L.
T2DM = type 2 diabetes mellitus, BMI = body mass index, TG = triglycerides.

