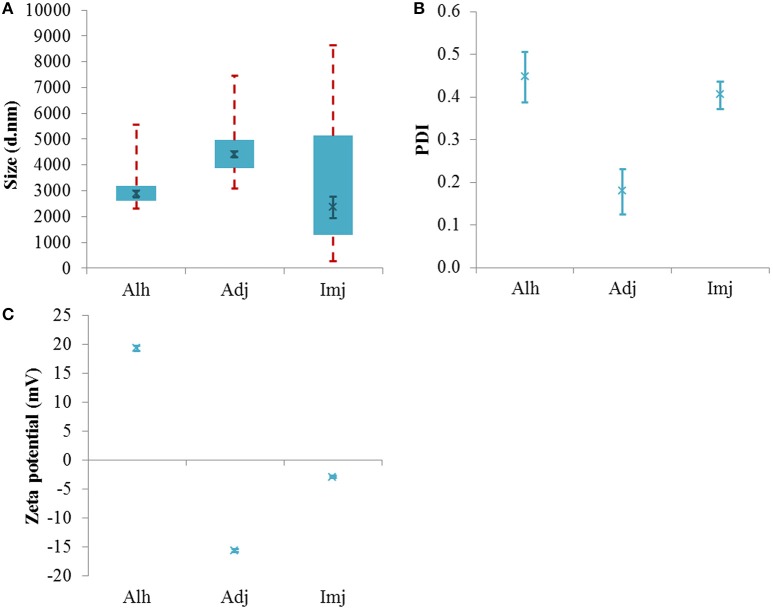
Figure 2.
Particle size distributions (A), PDI values (B), and zeta potential (C) of aluminum adjuvants prepared in saline to form simulant vaccines containing ca 250 μg/mL Al. Box plots are representative of the interquartile range of the data while red dashed lines indicate the maxima and minima. Solid green crosses represent the d50 distribution value (nm). Error bars represent the ±SEM of the measurement where n = 5.

