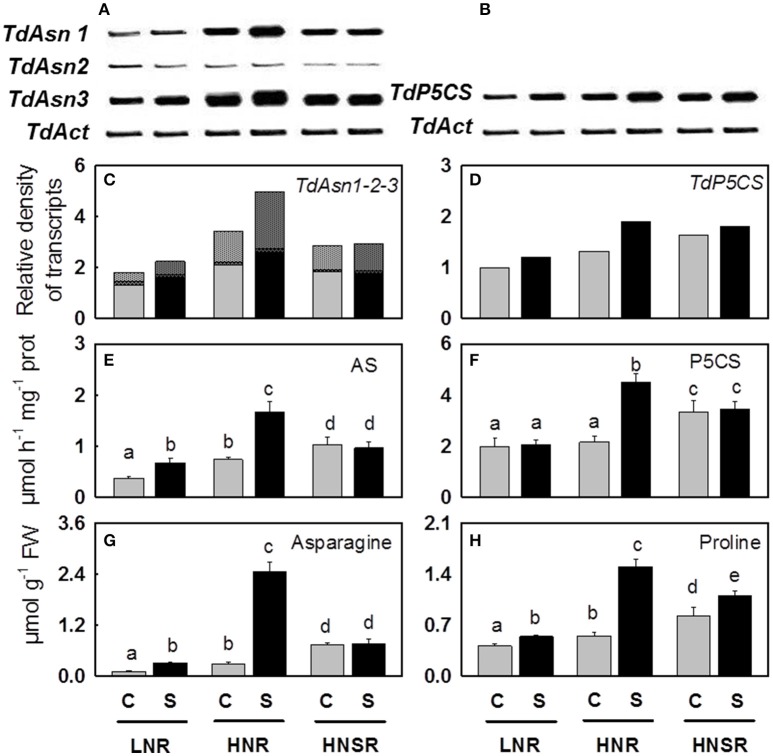
Figure 2.
Asparagine synthetase (Asn1, Asn2, and Asn3) (A) and Δ1-pyrroline-5-carboxylate synthase (P5CS) (B) genes and their relative densitometric quantification normalized using the actin signals (C,D), the AS (E) and P5CS (F) enzymatic activities, the content of asparagine (G), and proline (H) in roots of control ( ) and salt stressed (
 ) plants. Plants were subjected to salt stress starting from day 10 of culture. Control plants were grown without NaCl addition. Plants were harvested after 20 days of hydroponic culture. The values are mean ± SD (n = 4). Different letters above bars indicate significant difference between treatments (p < 0.05, LSD-test).

