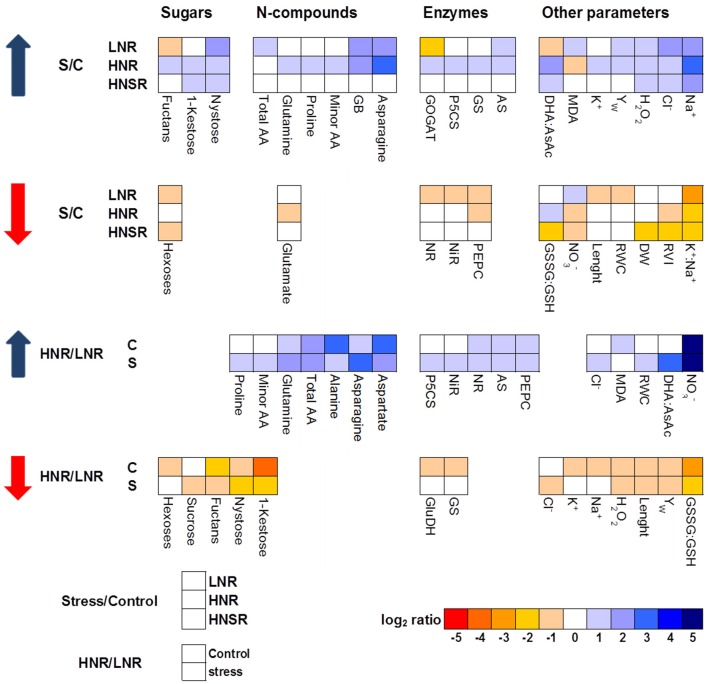
Figure 3.
Heat map analysis summarizing the plant responses to nitrogen nutrition and salinity. Results were calculated as Logarithm base 2 (Log2) of salt stressed values/control values (S/C) or high nitrogen/low nitrogen (HN/LN) for all the treatments, LN, HN, and HNsplit (LNR, HNR, and HNSR). Results were visualized using a false color scale, with blue indicating an increase and red a decrease of values relative to those in control condition. No differences were visualized by white squares.

