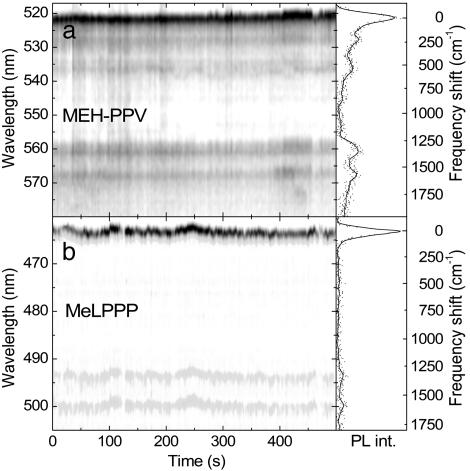
Fig. 2.
Time-dependent PL spectra for a single MEH-PPV (a) and MeLPPP (b) molecule at 5 K. The temporal resolution is 3 s in a and 2 s in b. The grayscale corresponds to the PL intensity. The integrated PL spectra are shown (Right) and are shifted in frequency by their peak position to allow a direct comparison of the vibrational modes.

