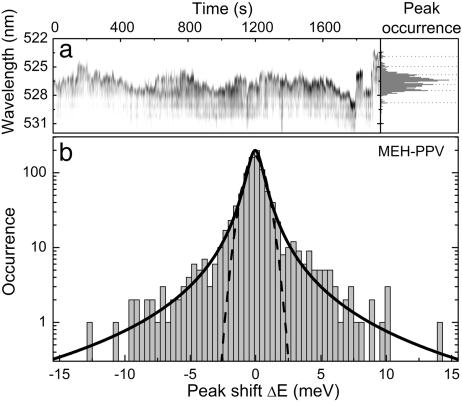
Fig. 4.
Spectral diffusion in the emission of a multichromophoric molecule. (a) Fluorescence trace of a single MEH-PPV molecule consisting of 960 spectra (2-s resolution) exhibiting multichromophoric emission together with a histogram of the peak positions displaying a number of discrete maxima (marked by dashed lines) caused by the presence of different chromophore units. (b) Corresponding jump frequency histogram. The solid line shows a Lorentzian fit (width 1.3 meV) to the data. A Gaussian (width 1.5 meV) is also plotted for comparison.

