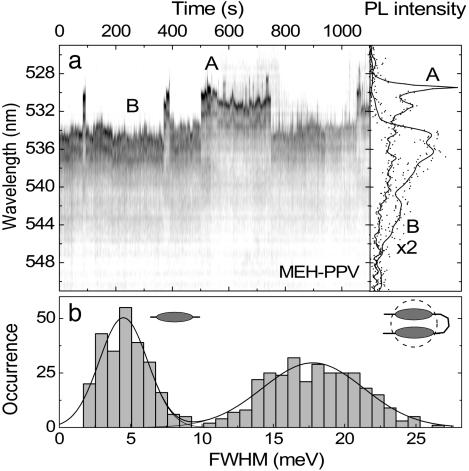
Fig. 6.
Switching between aggregated and free chromophore emission in MEH-PPV. (a) PL trace of a single MEH-PPV molecule (2-s resolution) revealing discrete jumps between narrow, single-chromophore emission (A) and broad, aggregated emission (B). (b) Histogram showing the occurrence of a particular spectral width for 500 spectra.

