
Figure 5.
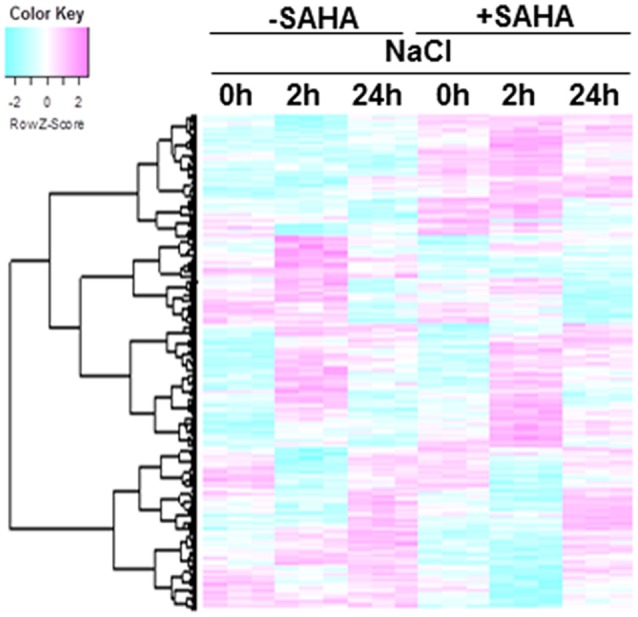
Hierarchical cluster analysis of salt-responsive genes and SAHA-responsive genes in cassava roots. The expression profiles of cassava genes were obtained from cassava plantlets treated with 100 μM SAHA for 24 h then subjected with 200 mM NaCl for 2 and 24 h. Transcript data was generated from 3 replicates. The heat map represents the Z-score. The key shows the Z-score region from −2 to 2. Red represents up-regulated genes while blue represents down-regulated genes. The 4389 differentially expressed genes were detected using one-way ANOVA, BH FDR < 0.0001.