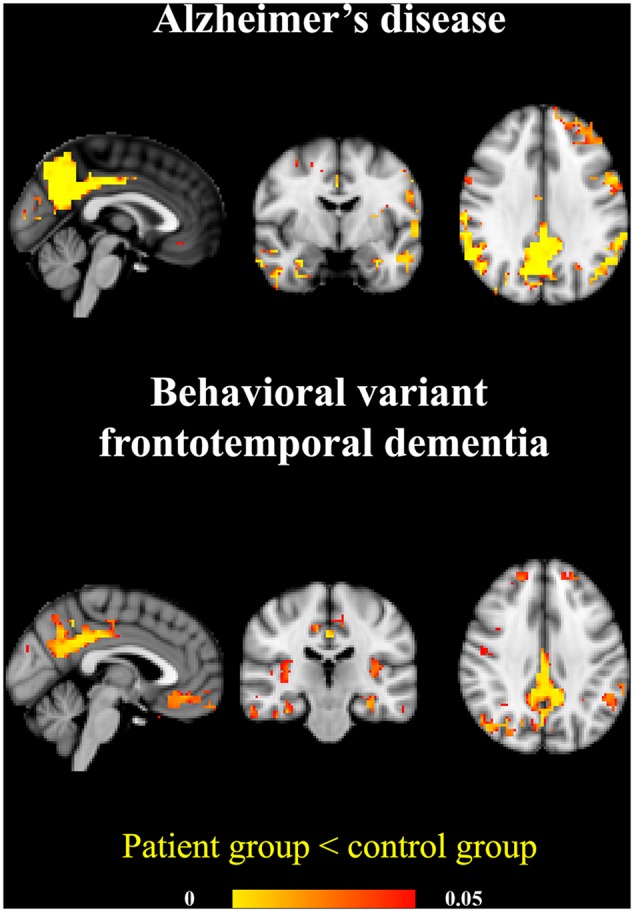
FIGURE 3.

Atrophy patterns in AD and bvFTD. The AD group showed prominent temporoparietal atrophy. In the bvFTD group the atrophy was located in posterior cingulate gyrus and precuneus and also on frontal lobes and insula. Significant atrophy is marked in yellow (p < 0.05).
