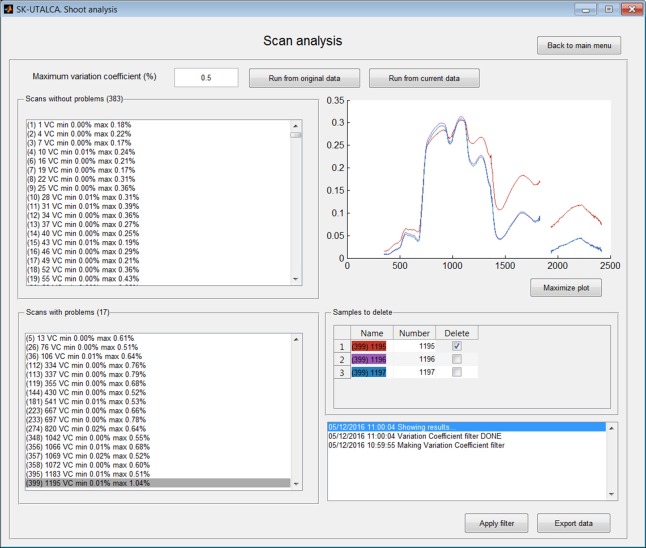
Figure 3.
Example of scan analysis. The software divided the scans or plots between those that did not surpass the maximum accepted variation coefficient (Scans without problems) and those where it was exceeded (Scans with problems). Scan 399 was selected, and its first sample (red) was identified for deletion (Apply filter).

