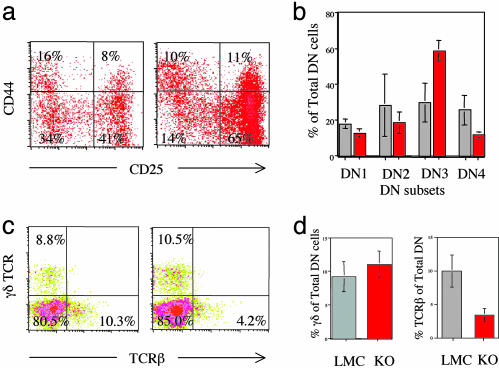
Fig. 2.
DN thymocyte development in mybF/F/LckCre mice. Two-color flow cytometric analysis (a) and quantitation (b) of CD44 and CD25 surface expression on thymocytes. Two-color flow cytometric analysis (c) and quantitation (d) of surface γδ TCR and TCRβ within the total DN population within the live lymphoid gate of c-myb mutant (red bar) or littermate controls (gray bar).

