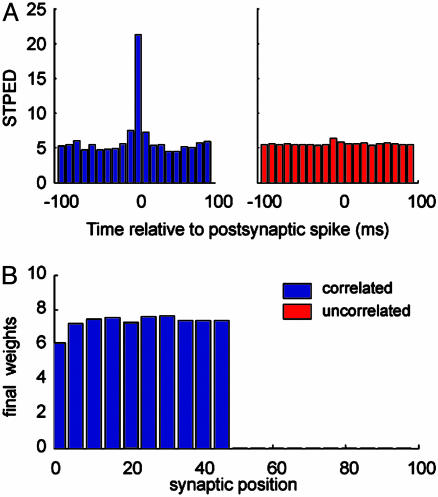
Fig. 3.
Selectivity to correlated inputs. (A) The STPED shows the number of presynaptic events that occur at different time lags with respect to a postsynaptic event. The STPED peaks immediately before a postsynaptic spike for the correlated (blue) channel but is flat for the uncorrelated (red) channel. Results are for a input rate of 10 Hz, and intervals were binned at every 10 ms. (B) The final weight distribution is bimodal, and the correlated group is selectively potentiated (synapses 50-100 are zero, and thus hardly visible in the figure). The segregation is only possible with the implementation of a homeostatic calcium control.

