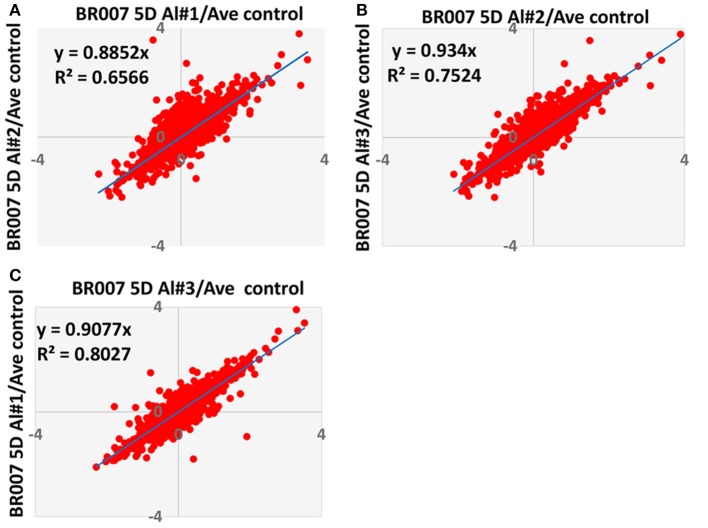
Figure 3.
Comparison of Log2 iTRAQ ratios for all proteins identified in three biological and analytical replicates of each experiment. This figure shows an example of comparison of ratios from BR007 5D Al treated sample #1, #2, and #3 vs. average control. (A) #1 vs. #2; (B) #2 vs. #3; (C) #3 vs. #1.

