Figure 1.
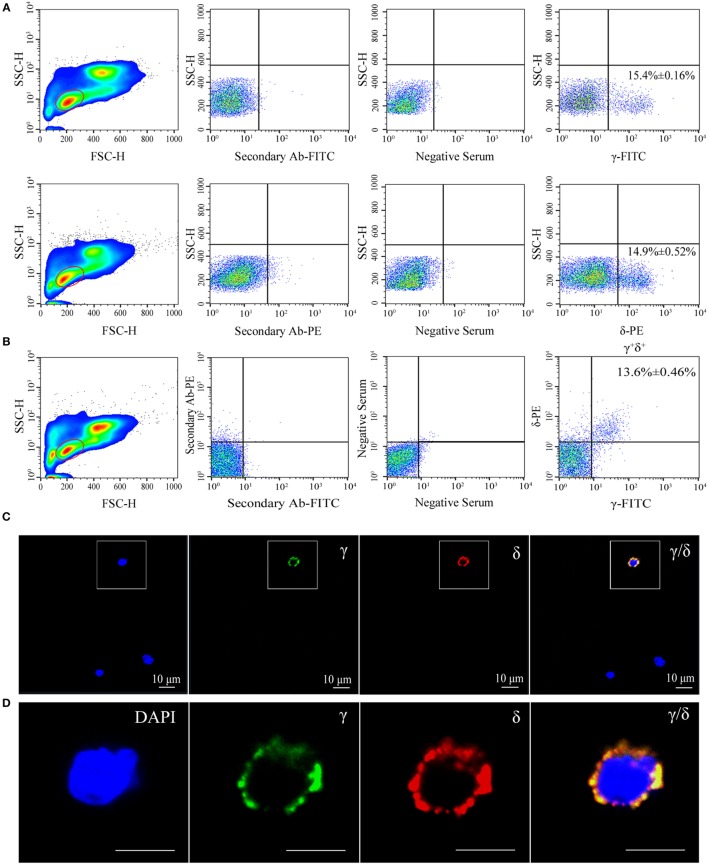
Flow cytometry (FCM) and immunofluorescence analyses of γ+δ+ cells in zebrafish. (A) FCM detection of γ and δ single-positive (γ+ and δ+) cells in leukocytes from zebrafish peripheral blood, head kidney, and spleen tissues, respectively. The left panels show FSC/SSC analyses and the red-outlined gates represent lymphoid cells. Middle panels represent the cells treated only with the secondary Ab (FITC-conjugated goat anti-rabbit IgG or PE-conjugated goat anti-mouse IgG) and with the preimmunization serum. The right panels represent staining of cells with rabbit anti-γ or mouse anti-δ Abs. (B) FCM detection of γδ-double positive (γ+δ+) cells in leukocytes from zebrafish peripheral blood, head kidney, and spleen tissues. FSC/SSC analyses are shown in the left panel and red-outlined gate represents lymphoid cells. The middle panel shows the analysis of cells incubated only with secondary Abs and with the preimmunization serum. The right panel represents double staining of cells with rabbit anti-γ and mouse anti-δ Abs. (C) Confocal microscopy image of γ+δ+ cells stained with rabbit anti-γ and mouse anti-δ Abs. Non-related Abs, including mouse IgG and rabbit IgG, were used as negative controls (data not shown). DAPI stain showed the locations of the nuclei. A laser-scanning confocal microscopy (Zeiss LSM-710) was used in the analyses (original magnification ×630, scale bar, 10 µm). (D) Enlarged images of γ+δ+ cells in the white-outlined square of E. Scale bar, 5 µm.

