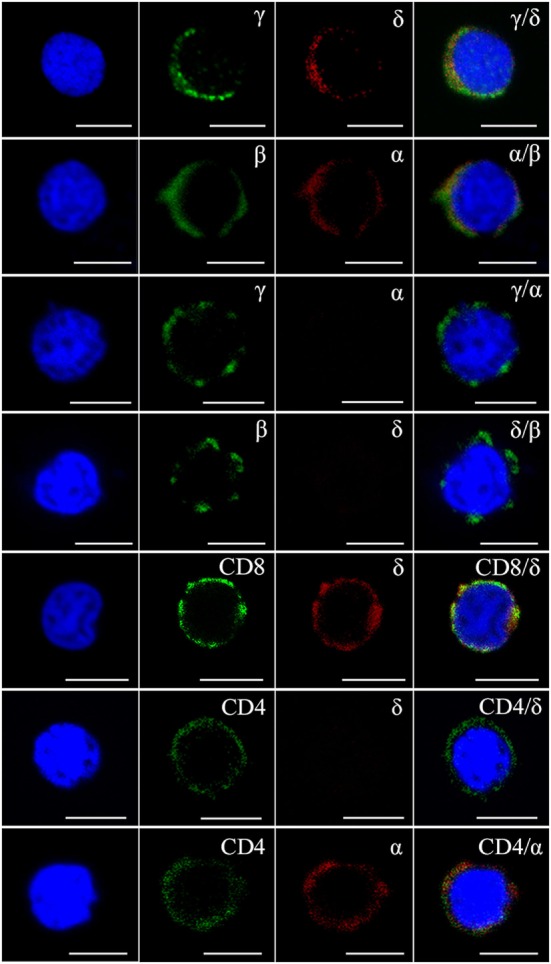
Figure 3.

Immunophenotype analysis of zebrafish γδ T cells by Abs against various surface molecules. The magnetic sorted cells were double stained with anti-γ, anti-δ, anti-α, anti-β, anti-CD8, and anti-CD4 Abs in different combinations (rabbit anti-γ/mouse anti-δ, rabbit anti-β/mouse anti-α, rabbit anti-γ/mouse anti-α, rabbit anti-β/mouse anti-δ, rabbit anti-CD8/mouse anti-δ, rabbit anti-CD4/mouse anti-δ, and rabbit anti-CD4/mouse anti-α, respectively). Positive control cells were stained with rabbit anti-β and mouse anti-α Abs. Non-related Abs, including mouse IgG and rabbit IgG, were used as negative controls (data not shown). DAPI stain showed the locations of the nuclei. A laser-scanning confocal microscopy (Zeiss LSM-710) was used in the analyses (original magnification × 630, scale bar, 5 µm).
