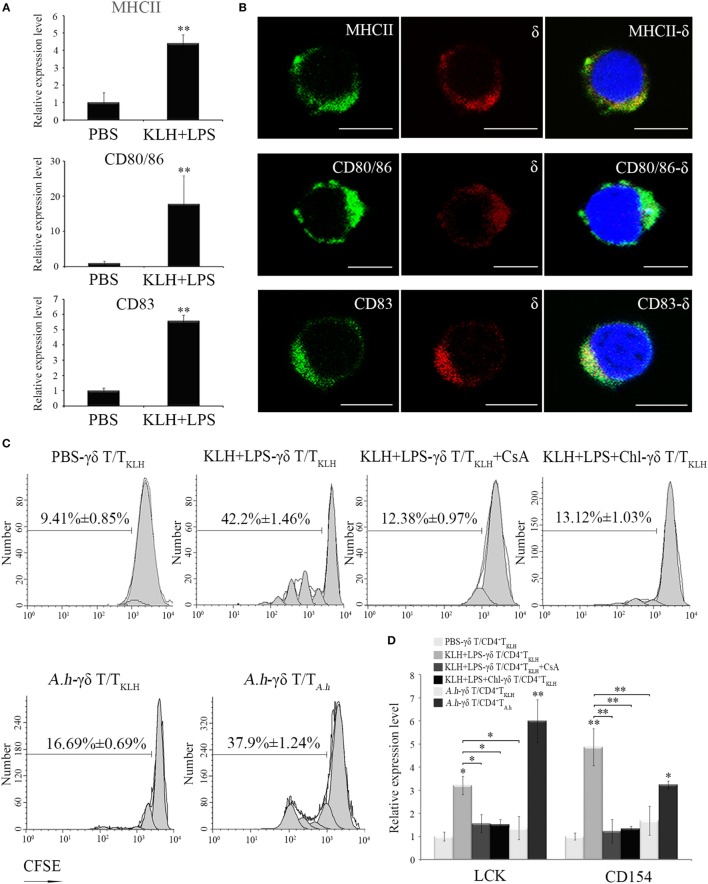
Figure 5.
In vitro evaluation of Ag-presenting capacity of zebrafish γδ T cells. (A) Real-time PCR analyses of the expression levels of MHC-II, CD80/86, and CD83 in PBS- and KLH, plus LPS-loaded γδ T cells in vitro. (B) Immunofluorescence staining of δ+MHC+, δ+CD80/86+, and δ+CD83+ cells. Leukocytes were stained with mouse anti-δ and rabbit anti-MHCII, CD83, and CD80/86, respectively. Non-related Abs, including mouse IgG and rabbit IgG, were used as negative controls (data not shown). DAPI stain showed the locations of the nuclei. Original magnification ×630. Scale bar, 5 µm. (C) The proliferation and activation of CD4+ TKLH cells primed by Ag-loaded γδ T cells were determined after CFSE dilution and measured via FCM. The proliferation of CD4+ TKLH cells primed by mock PBS-treated γδ T cells served as a negative control. Cyclosporine A was used for the T cell inhibitor control. For the Ag-presentation inhibition control, γδ T cells was pretreated with Chloroquine for 1 h and then incubated with Ags. In cross-stimulation control group, the KLH-pulsed γδ T cells were co-cultured with CFSE-labeled CD4+ TA.h cells. The numbers above the marker bars indicate the percentage of CFSE-diluted cells in each panel. Data represent three independent experiments. (D) The expression levels of Lck and CD154 were detected through real-time PCR. Means ± SD of three independent experiments are shown. *P < 0.05, **P < 0.01.

