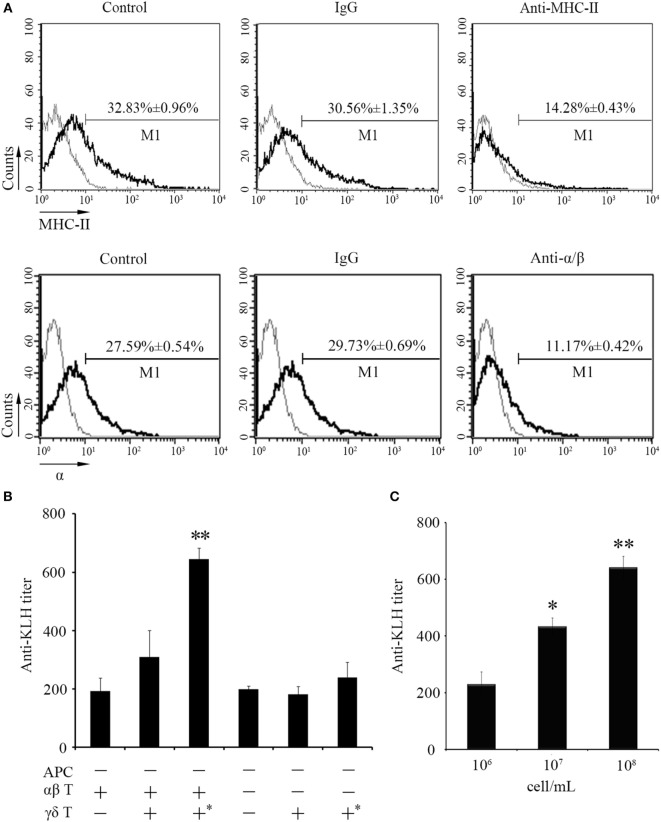
Figure 8.
An adoptive transfer assay of γδ T cells in the IgM production. (A) The effect of anti-MHC-II Ab and anti-α/β Abs on in vivo depletion of antigen-presenting cells (APCs) and αβ T cells were assessed by FCM. Negative controls treated with PBS or normal rabbit IgG were created. Light gray graphs show the background staining with an irrelevant Ab on the target gated population. The numbers above the marker bars indicate the percentage of MHC-II+ APC and α+ T cells in each treatment group. Each result was obtained from 30 fishes. (B) ELISA for KLH-specific IgM Abs in the serum of fishes received adoptive transfer in different-treatment combinations. All the recipient fishes were administered with anti-MHC-II Ab to eliminate the basal MHC-II+ APCs. Double depletion of APCs and αβ T cells was performed by co-administration with anti-MHC-II Ab and anti-α/β Abs into fishes followed by the transfer of γδ T cells. The “APC−” group means recipient fishes with an efficient APC-depletion as shown in (A) (upper panel); the “αβ T−” group means recipient fishes with an efficient αβ T cell-depletion as shown in (A) (lower panel); the “αβ T+” group means recipient fishes with no depletion treatment; the “γδ T−” group means recipient fishes with no γδ T cell adoptive transfer; the “γδ T+” group means recipient fishes received adoptive transfer of non-activated γδ T cells; the “γδ T+*” group means recipient fishes received adoptive transfer of activated γδ T cells with antigen (KLH in combination of LPS) stimulation. These groups were assembled in different combinations as designated in the figure body for different experimental purpose. (C) ELISA for KLH-specific IgM Abs in the serum from the recipient fishes transferred with different dosages (106, 107, and 108 cell/mL) of activated γδ T cells. All of the groups were titered from 1/100 to 1/800, and the titers were ascertained based on the highest serum dilution, at which the A450 ratio (A450 of postimmunization sera/A450 of preimmunization sera) is ≥ 2.1. The data of the background control group with PBS administration were subtracted from each experimental group.

