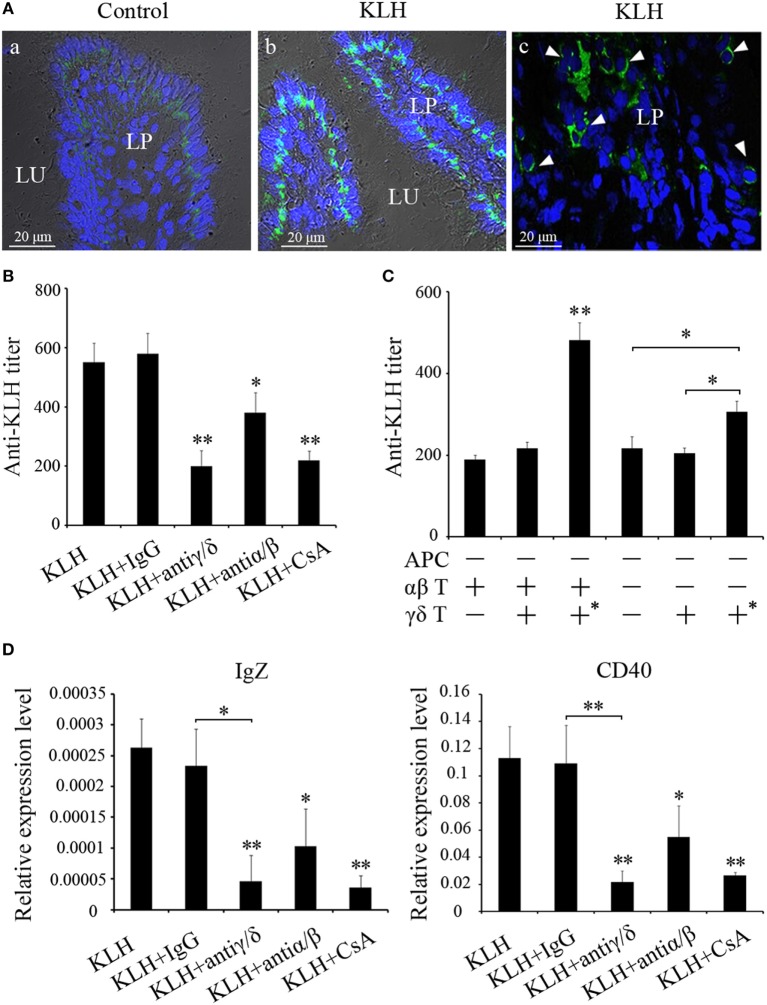
Figure 9.
Evaluation of zebrafish γδ T cells in mucosal IgZ production. (A) Differential interference contrast images of immunofluorescence staining of zebrafish hind-gut cryosections from control fish (a) and fish that had been stimulated with KLH (b), stained for DrTRGC (green) and nuclei are stained with DAPI. Enlarged images of the LP (c), without differential interference contrast, showing infiltrating γδ T cells that marked with white arrows in the gut lamina propria. LP represents lamina propria and Lu represents gut lumen. (B) The titers of IgZ against KLH in each treatment group were examined by ELISA. The control groups immunized with KLH only. (C) ELISA for KLH-specific IgZ Abs in the intestine mucus from the recipient fishes with adoptive transfer in different-treatment combinations. All the treatments and combinations were consistent to that shown in Figure 8B. The titer was ascertained based on the highest serum dilution at which the A450 ratio (A450 of postimmunization sera/A450 of preimmunization sera) is ≥ 2.1. The data of the background control group with PBS administration were subtracted from each experimental group. (D) The expression levels of IgZ and CD40 in the metenteron were determined by real-time PCR. Means ± SD of three independent experiments are shown. *P < 0.05, **P < 0.01.

