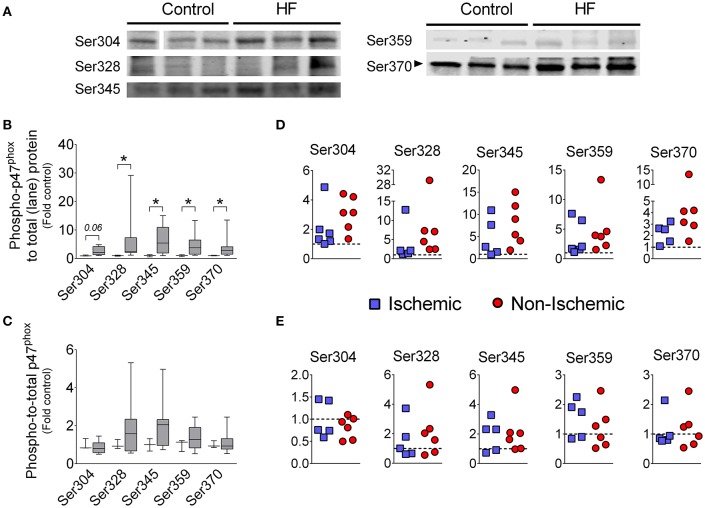
Figure 2.
Levels of serine phosphorylation of p47phox in diaphragm of patients with end-stage HF. (A) representative images of immunoblots, (B,D) levels of phosphorylated p47phox normalized to total protein loaded into gel lane, (C,E) levels of phosphorylated p47phox normalized to immunoblot signal of total p47phox (from this figure). Controls (open boxes; n = 3) and HF patients (gray boxes; n = 9–11). Panels D and E are individual data from patients normalized to average of controls (dotted line)—y-axis labels as in (B,C), respectively. Representative protein gels are similar to that shown in Figure 1. *P < 0.05 by Mann-Whitney test.

