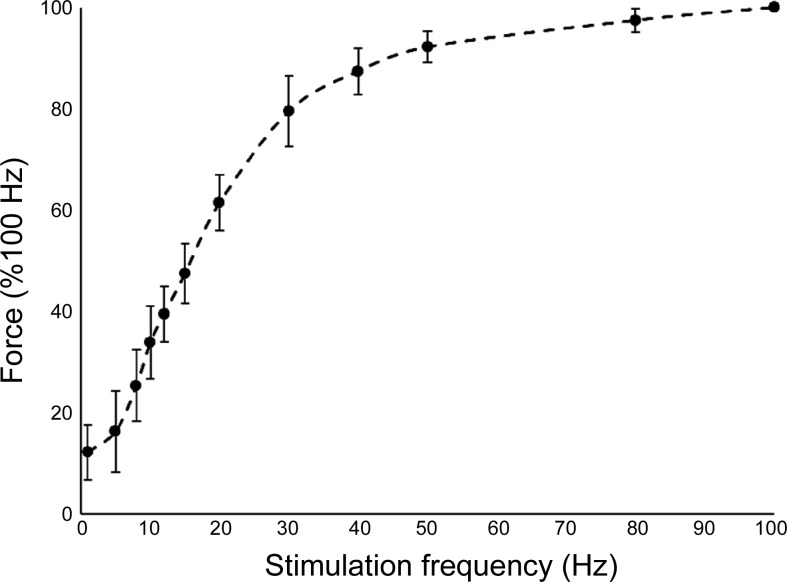
Fig. 2.
Stimulated force-frequency relationship of the posterior thigh in the seated position with the knee joint angle at 160°. Peak tetanic tension of was normalized to the maximal peak tension of each subject recorded at 100 Hz. Mean maximal peak tension achieved was 30.0 (5.2)% MVC from the 11 participants. Error bars represent SD; n = 10.

