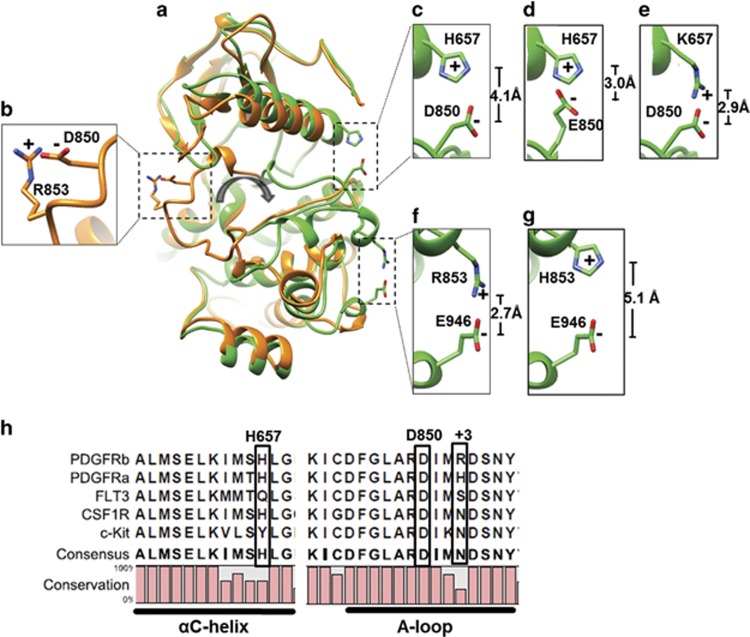
Figure 1.
Protein models of the PDGFRβ TKD structure. (a) The modelled DFG-out (orange) and DFG-in (green) conformations of PDGFRβ TKD are displayed. The zoom-in windows show the relevant stabilizing electrostatic interactions with the corresponding distances between charges: (b) D850-R853 in the DFG-out model; (c) H657-D850, (d) H657-E850, (e) K657-D850, (f) R853-E946 and (g) H853-E946 in the DFG-in model. Oxygen atoms carrying negative charge are marked in red, nitrogen atoms carrying positive charge in blue. The gray arrow in the center indicates rotation of the A-loop upon transition from inactive to active state. (h) Sequence alignment of RTKs from the PDGFR family depicting the region covering αC-helices and A-loops of PDGFRα, PDGFRβ, FLT3, CSF-1 R and c-Kit.

