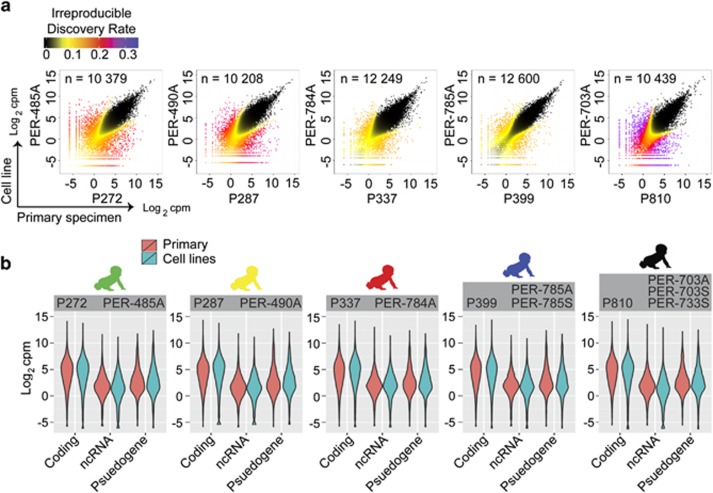
Figure 1.
Comparative analysis of iALL patient and matched cell line transcriptomes. (a) Scatterplots of normalized RNA-seq count data (log2 counts per million) displaying correspondence between patient sample (x axes) and a representative matched cell line (y axes) defined using the IDR algorithm. Data points are coloured according to IDR value. The number of genes showing corresponding expression (below a cutoff IDR<0.05) for paired samples are shown within each plot. (b) Violinplots displaying RNA-seq count data from patient and matched cell lines partitioned by gene categories defined using Ensembl annotations, including protein-coding genes (n=12130), non-coding RNAs (n=1855) and pseudogenes (n=1261).

