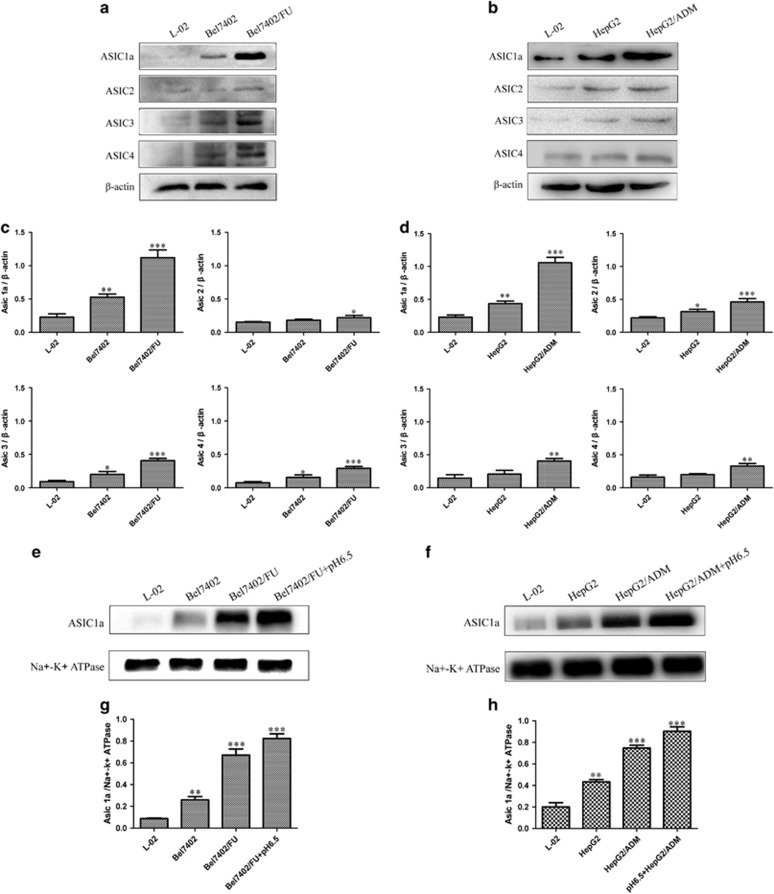
Figure 2.
ASIC1a and 2, 3, 4 protein expression levels in resistant HCC cells. (a and b): Western blotting analysis of ASIC1a and 2, 3, 4 protein expression levels in L-02, Bel7402, Bel7402/FU, HepG2, and HepG2/ADM cells. (c and d): Histogram showing the semiquantitative analyses of the gels from western blotting. (e and f): Membrane ASIC1a protein expression levels in L-02, Bel7402, Bel7402/FU, HepG2, and HepG2/ADM cells. (g and h): Histogram showing the semiquantitative analyses of the gels from western blotting. Western blot bands are representative of three independent experiments. Data were expressed as the mean±s.d., *P<0.05 versus L-02 group, **P<0.01 versus L-02 group, ***P<0.001 versus L-02 group.

