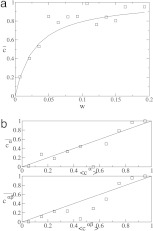
Fig. 3.
Statistics of motif ensembles. (a) Testing the statistical model for single subgraphs (Eq. 5). Nontreelike subgraphs are enumerated and node pairs i, j are binned according to wij. The fraction of such pairs carrying a link is shown against wij. The solid line results from fitting the model with enhanced number of links (Eq. 5) to these data, giving σ = 3.8. (b) Testing the statistical model for alignments (Eq. 8). (Upper) The average value of  over all α, i, j with a given expectation value of
  according to Eq. 8 at σ = σ* = 3.8 and μ = μ* = 2.25 against the corresponding expectation value (□). For a perfect fit between model and data a straight line is expected (shown solid). (Lower) The same procedure is used averaging the two-point function
  over all α, β, i, j with a given expectation value
  .
.

