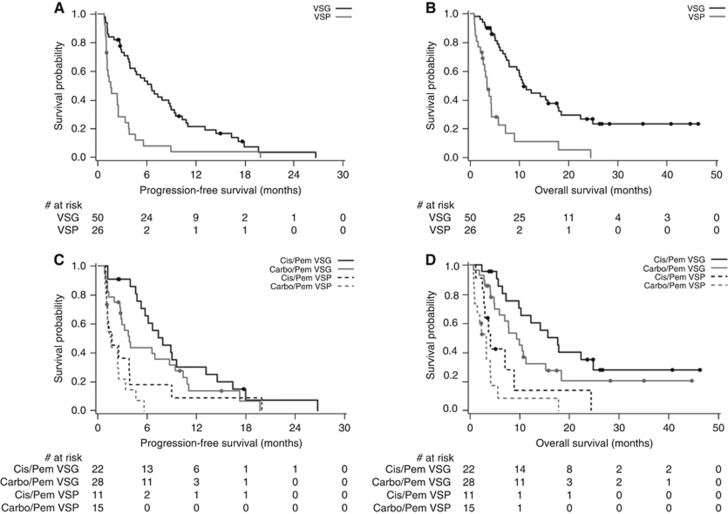
Figure 2.
Kaplan–Meier curves of PFS and OS. (A) Progression-free survival by VeriStrat in overall population. (B) Overall survival by VeriStrat in overall population. (C) Progression-free survival by VeriStrat in treatment subgroups. (D) Overall survival by VeriStrat in treatment subgroups. Abbreviations: VSG=VeriStrat Good; VSP=VeriStrat Poor.

