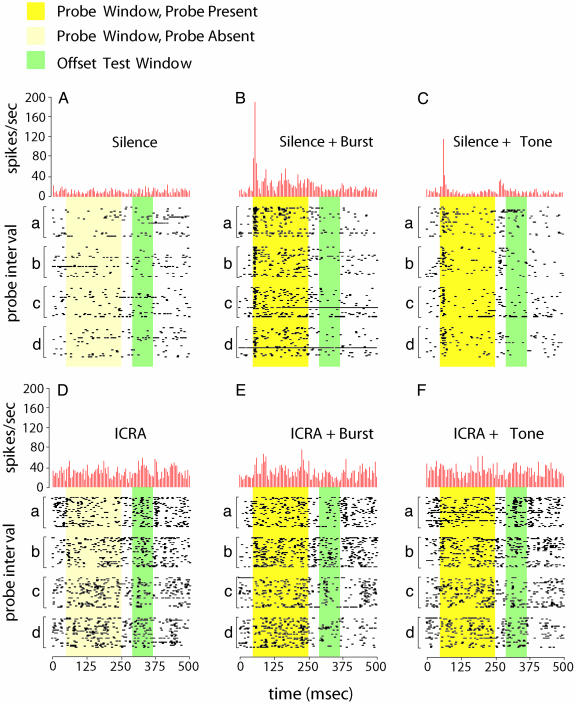
Fig. 3.
Individual recording example. Shown are the response, 500-msec time windows around the time of probe presentation. Raster subplots (a-d) show the response to 30 stimulus repetitions and are organized sequentially so that section a is drawn from an early segment of the recording, with sections b, c, and d drawn from successively later sections of the same recording. Yellow background denotes the probe presentation window, with darker yellow in panels that show when the probe was actually presented. Green background denotes an offset response analysis window. Histograms express the average firing rate across all four segments, in 5-msec bins. Details of the response patterns are described in the text. Probes: no probe (A and D); gated burst of Gaussian noise (B and E); and gated sinusoidal tone (C and F). Noise: silence (A-C) and ICRA noise (D-F).

