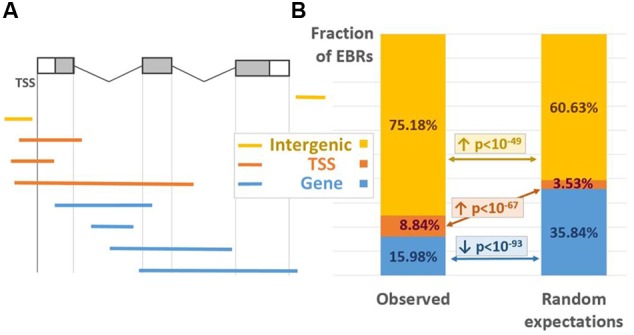
FIGURE 1.

EBRs distribution between various location classes. (A) The positioning of EBRs corresponding to three location classes relative to the gene structure. White/gray boxes denote UTRs/exons; black lines denote introns. (B) Observed (left) and expected (right) fractions of the EBRs referred to three location classes. The p-values were derived from Monte-Carlo permutation test (Boldyreva et al., 2016; see Analysis of the Distribution of EBRs). The arrows up/down denote significant enrichment/depletion. Yellow/red/blue colors denote INTERGENIC/TSS/GENE location classes.
