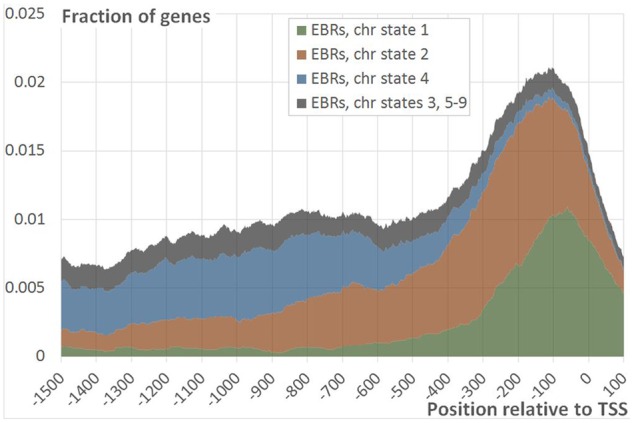
FIGURE 4.

Distribution of EBRs in different chromatin states. The figure shows the fraction of the genes mapped to EBRs within the specific chromatin state at a certain distance from TSS as a function of the position relative to TSS. Summation of fractions of genes mapped to EBRs with chromatin states 1 (green), 2 (red), 4 (blue) and all the rest states (gray) gives the total distribution of EBRs relative to TSS (data row ‘Real’ on Figure 2).
