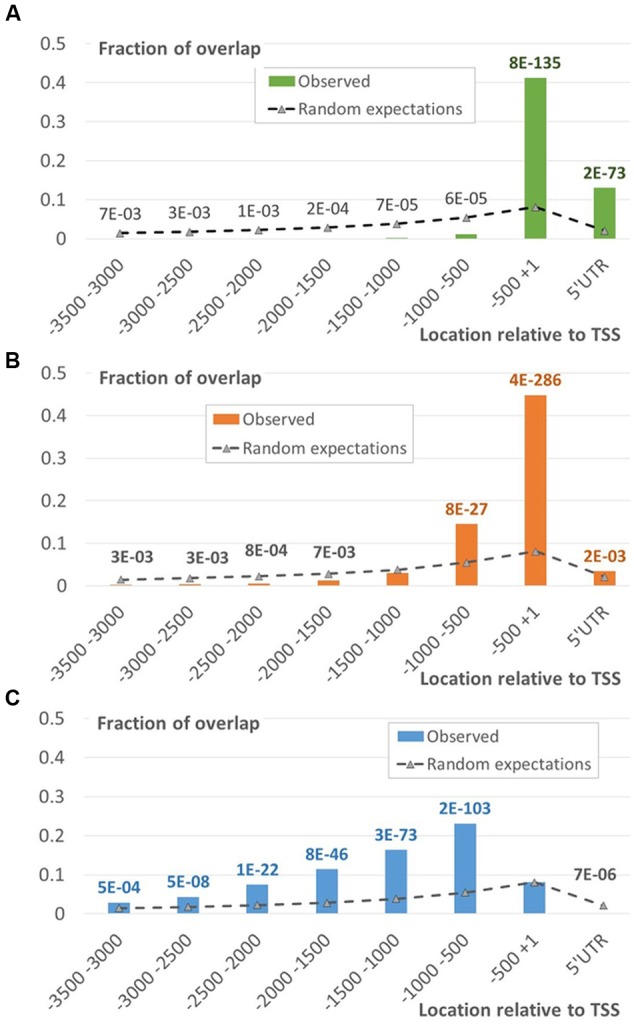
FIGURE 5.

Distribution of EBR fragments located within the chromatin states 1, 2 and 4. The distributions of EBRs located in the domains of chromatin states 1 (A), 2 (B), or 4 (C) mapped to specific intervals of the upstream gene regions. X-axis denotes genomic intervals relative to TSS, Y-axis – the ratio of total length of overlap between EBR fragments and a certain interval to the total length of EBR fragments. Data labels denote p-values derived from the Monte-Carlo permutation test (Khoroshko et al., 2016; see Materials and Methods). Green/Blue/Red fonts of labels denote enrichment of the observed values respective to the expected ones, the gray font corresponds to depletion.
