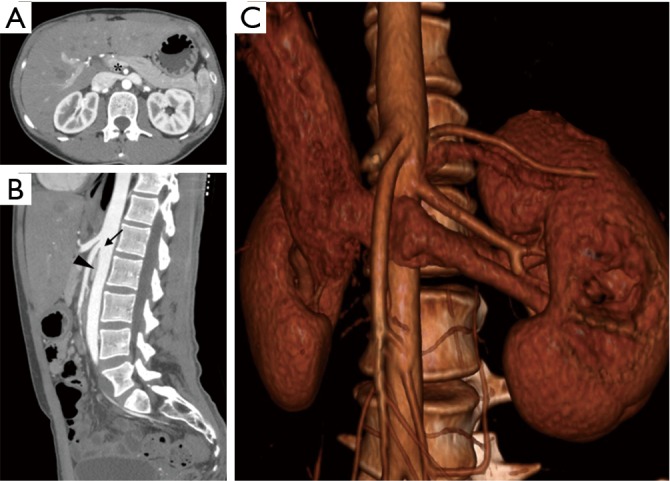
Figure 5.

Axial and sagittal computed tomography angiography (CTA)/computed tomography venography (CTV) with three-dimensional (3D) reconstruction at the level of the aortomesenteric angle. A split-bolus technique was used to opacify both the arterial and venous structures in the same phase. (A) Axial CTA/CTV shows significant decrease in diameter of the left renal vein as it crosses between the aorta and superior mesenteric artery (*); (B) sagittal CTA/CTV shows a very acute aortomesenteric angle (arrow) measured at 15 degrees, with resultant compression of the left renal vein (arrowhead); (C) left anterior inferior oblique view of the nutcracker phenomenon using 3D reconstruction of the same CTA/CTV. The celiac axis has been removed from the viewing plane to facilitate evaluation of aortomesenteric compression.
