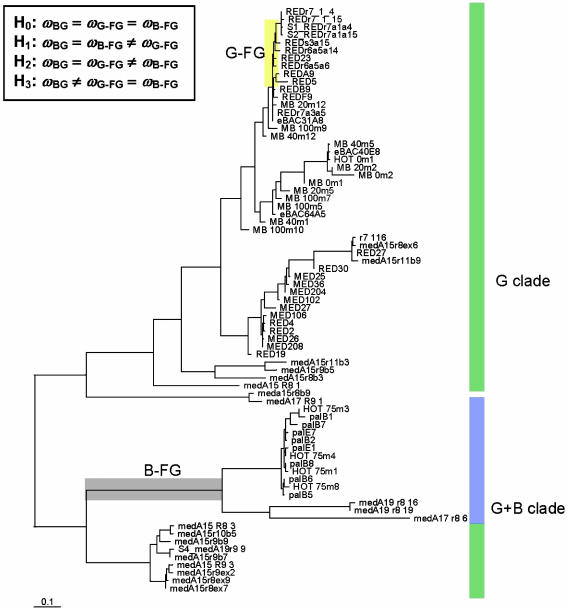
Fig. 1.
Phylogenetic tree inferred from nucleotide variation contained in the 75-PR data set. The branch lengths are scaled to the mean number of substitutions per codon site, as inferred under codon model M3. Branches along which amino acid substitutions had occurred at position 105 are highlighted in yellow and gray and are signified by FG. All other branches are signified by BG. The FG branch highlighted in gray corresponds to the evolution of B-PRs and is labeled B-FG. FG branches highlighted in yellow correspond to a period of diversification of green PRs and hence are labeled G-FG. Differences in selection pressure among BG and FG branches can be modeled by specifying different ω ratios for these sets of branches. Four hypotheses of variable selection pressure among BG and FG branches are specified as H0, H1, H2, and H3.

