Figure 3.
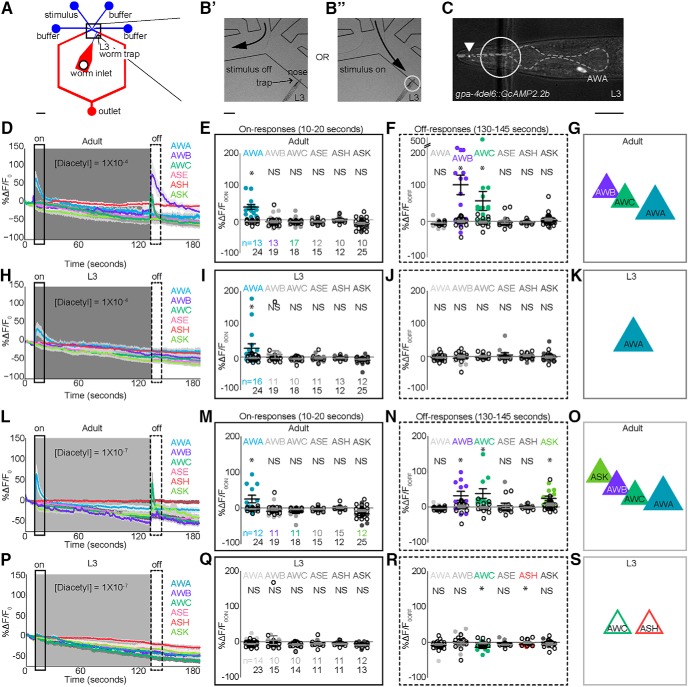
Juveniles and adults use different sensory neurons to encode diacetyl. A, Schematic of novel PDMS-based microfluidic device for imaging L3 neurons (see also Materials and Methods). B, Magnified views of L3 worm (circled region) trapped in device with stimulus off (B′) or stimulus on (B″). C, Example L3 AWA expressing GCaMP2.2b under a reduced gpa-4 promoter. Anterior is to the left. White arrowhead indicates portion of dendritic tip in nose. Dashed gray outlines pharynx; used to landmark the position of sensory neuron cell bodies. D, L, Adult AWA, AWB, AWC, ASE, ASK, and ASH responses to different concentrations of diacetyl stimulus. Solid lines indicate average, and the light shadow represents SEM. Gray box here and in subsequent figures highlights stimulus duration (10–130 s). E, M, Scatterplots showing ratio of fluorescence changes (average) in a 10-s window (black rectangle) after stimulus addition (on-responses, 10–20 s). F, N, Average responses in a 15-s window (dashed rectangle) after stimulus removal (off-responses, 130–145 s). A similar analysis was performed on L3, and the resulting traces and scatter plots are shown in H–K and P–S. Responders were estimated by comparing the average responses of individual neurons to the baseline controls (see Table 2 and Materials and Methods for details). Numbers of neurons imaged in each condition are shown in E, I, M, and Q (n). Adult AWA neurons responded to the addition of all presented [diacetyl], whereas L3 AWA neurons responded only to the highest presented [diacetyl] (compare D, H, L, and P). Moreover, adult AWB, AWC, and ASK responded to the removal of odor. Data in E, F, I, J, M, N, Q, and R were compared using two-tailed, unpaired t-tests (*p < 0.05). Solid colored circles represent responses of a given cell to odor, and open black circles represent the same cell’s response to a buffer-only control. Scale bar is 300 μm in A, 40 μm in B′, and 10 μm in C. G, K, O, S, Schematics of adult and L3 neurons encoding diacetyl.

