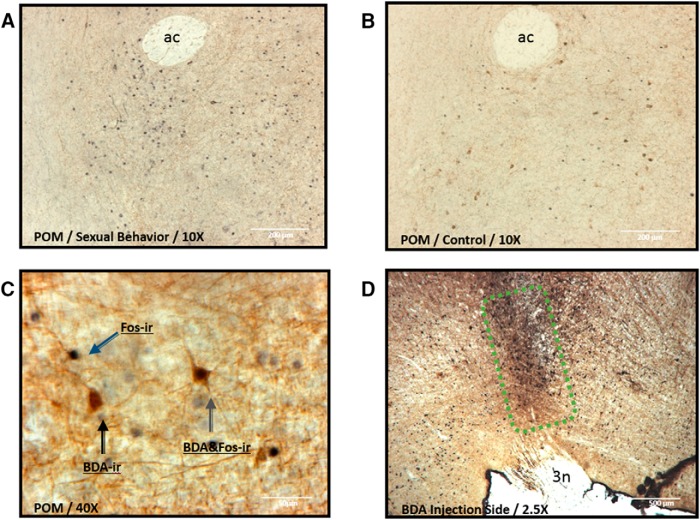
Figure 3.
A, B, Photomicrographs showing sagittal sections in the quantification area (boxed area) in the POM ventral to anterior commissure (ac) in a male of the SB group (A) or of the control (B) group. C, Higher-magnification photomicrograph in POM illustrating cells that are Fos immunoreactive (blue arrow), BDA positive (black arrow), or double labeled for BDA and Fos (green arrow). D, Example of an injection site of BDA within VTA dorsal to the oculomotor nerve (3n).

