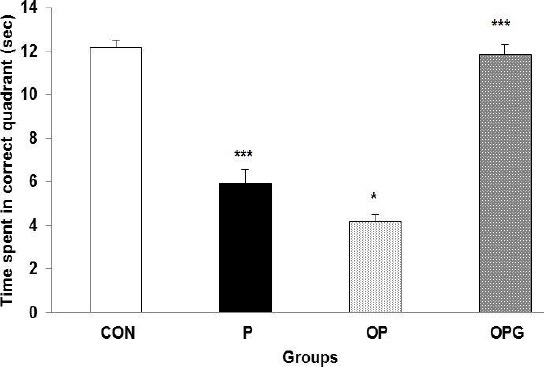
Figure 3.

Histograms illustrate mean time elapsed in the correct quadrant as an index of memory consolidation test. The P and specially the OP animals spent a significant shorter time in the target quadrant. Genistein improved the probe testing in the Parkinson-ovariectomized groups. Data are shown as Mean ± SEM.
*** difference between CON v. P (P=0.0001); * difference between P v. OP (P=0.05); *** difference between $$OP v. OPG (P=0.0001)
