
Figure 5.
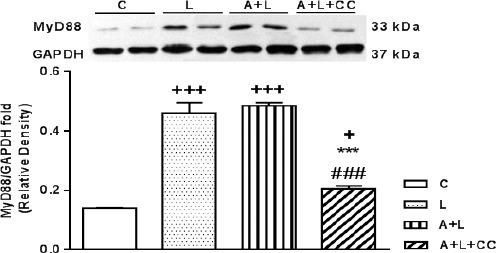
Representative immunoblots of MyD88 and GAPDH following 8 hr treatment, intraperitoneally, with L (LPS 2 mg/kg), A+L (A-769662 10 mg/kg+LPS 2 mg/kg) and A+L+CC (A-769662 10 mg/kg+2 mg/kg+compound-C 20 mg/kg) where C is control. Bars represent the ratio of MyD88 to GAPDH. Values are mean±SEM (n=5). +P<0.05, +++P<0.001 from respective control value, ***P<0.001 as compared with the LPS group and ###P<0.001 as compared with the A+L group, using one way ANOVA with LSD post hoc test