
Figure 6.
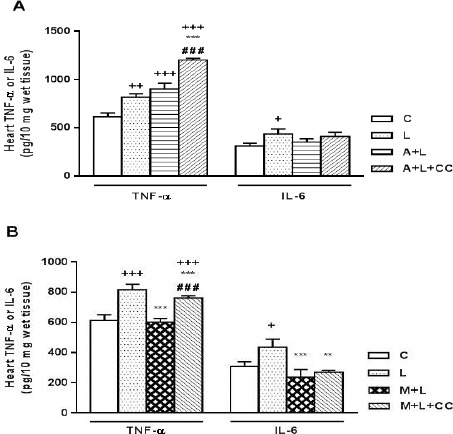
A) Concentration of TNF-α and IL-6 in mice myocardial tissues following 8 hr treatment, intraperitoneally, with L (LPS 2 mg/kg), A+L (A-769662 10 mg/kg+LPS 2 mg/kg) and A+L+CC (A-769662 10 mg/kg+2 mg/kg+compound-C 20 mg/kg) where C is control. Data are expressed as the mean±SEM of the four independent experiments. B) Concentration of TNF-α and IL-6 in mice myocardial tissues following 8 hr treatment, intraperitoneally, with L (LPS 2 mg/kg), M+L (metformin 100 mg/kg+LPS 2 mg/kg) and M+L+CC (metformin 100 mg/kg+2 mg/kg+compound-C 20 mg/kg) where C is control.