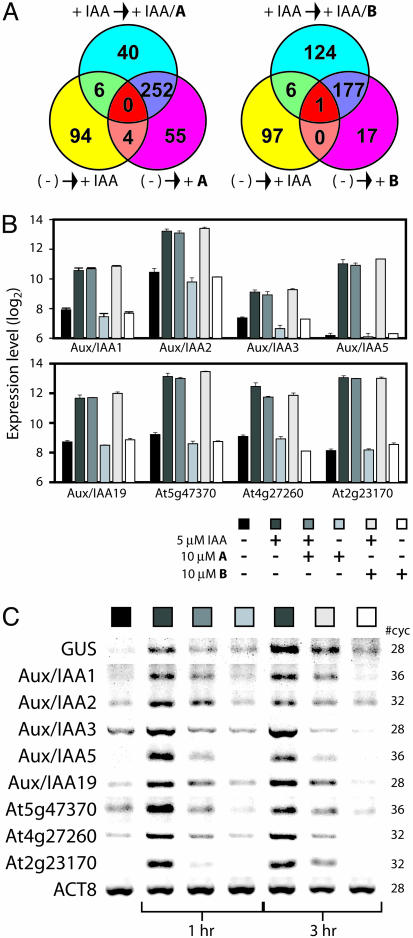
Fig. 5.
The transcriptional effects of inhibitor treatment. (A) Venn diagrams specify the number of 2-fold differentially regulated genes (P < 0.001) (induced or repressed) when comparing the indicated data sets. (B) Log2 expression values for selected auxin-induced genes from the microarray analysis for compounds A and B. Seven-day-old liquid culture-grown seedling clusters (Col-0) were treated for 1 h with IAA and/or inhibitor as indicated. (C) Semiquantitative RT-PCR analysis of the selected genes by using RNA from excised root tissue of BA3 seedlings treated with IAA and/or inhibitor for the indicated times. ACT8, ACTIN8.

