
Figure 3.
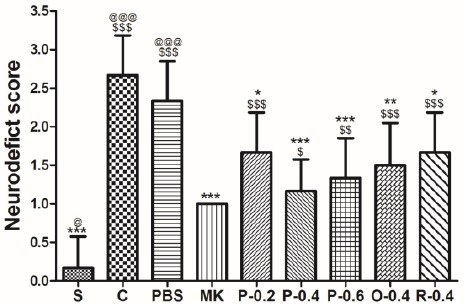
Effects of CT extract (CTE) on neurological deficit scores of ischemia–reperfusion (I/R)-injured rats. The scores were assessed 24 hr after reperfusion. Data are expressed as means±SD. S: sham group; C: control group; PBS: PBS group; MK: treatment with MK-801 group; P-0.2: pretreatment (P) with 0.2 g/kg CTE group; P-0.4: P with 0.4 g/kg CTE group; P-0.6: P with 0.6 g/kg CTE group; O-0.4: P with 0.4 g/kg CT E after occlusion group; R-0.4: P with 0.4 g/kg CTE after reperfusion group; $ P< 0.05, $$ P<0.01, $$$P<0.001 compared with the S group; * P<0.05, **P<0.01, ***P<0.001 compared with the C group; @ P<0.05, @@ P<0.01, @@@P<0.001 compared with the PBS group. n=6 in each group