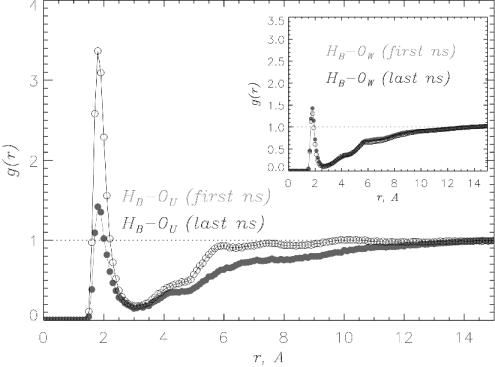
Fig. 7.
The pair correlation functions gHB–OU(r) (for the first and last nanoseconds in gray and black, respectively) are computed by using 11-ns simulations of Aβ16–22 DOs in 8 M OPLS urea solution. The plots offer dramatic illustration of the “invasion” of urea molecules into Aβ16–22 oligomers. The concentration of urea near peptide's backbone amides more than doubles in 11 ns. In contrast, the hydration of peptide backbone illustrated by gHB–OW(r) in Inset is virtually unchanged.

