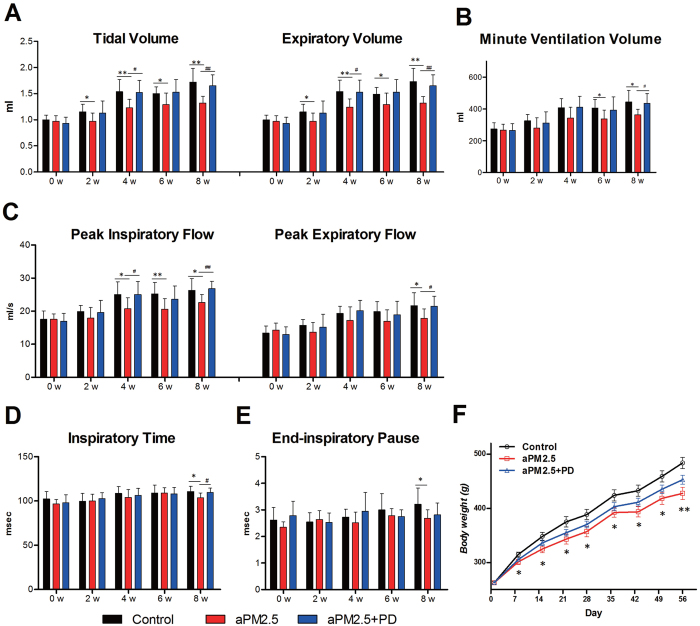
Figure 3. PD protects rats from aPM2.5 exposure.
PD improves the decrease in pulmonary ventilation function caused by aPM2.5. (A) Tidal volume and expiratory volume and (B) minute ventilation volume (ml). (C) The peak inspiratory and expiratory flow (ml/s). (D) Inspiratory time and (E) end-inspiratory pause (msec) of conscious rats. Data are expressed as means ± SD (n = 8). *P < 0.05, **P < 0.01, versus the control group. #P < 0.05, ##P < 0.01, versus the aPM2.5 group. (F) Body weight (g) development of rats during aPM2.5 exposure for 8 weeks. Data are expressed as the means ± SEM (n = 8). *P < 0.05, **P < 0.01, versus the control group.

