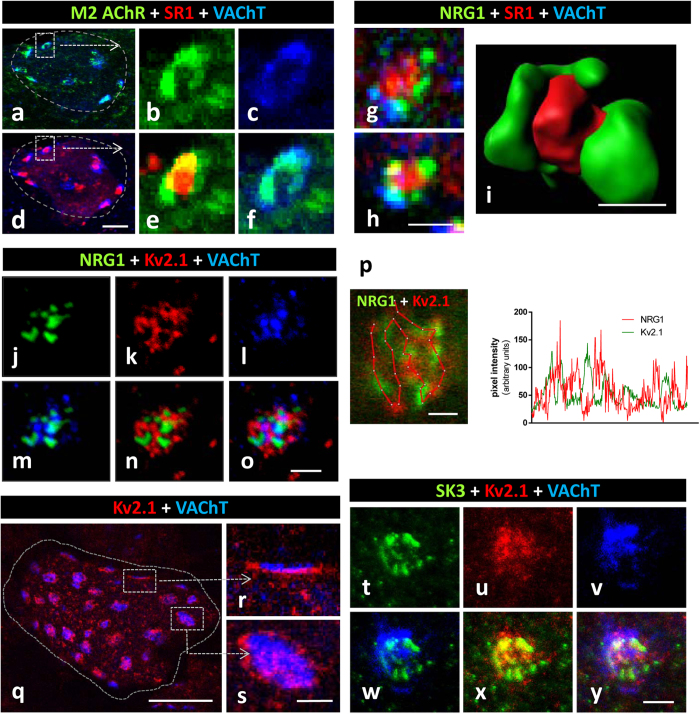
Figure 2. C-bouton proteins NRG1, S1R, Kv2.1 and SK3 are differentially clustered at the postsynaptic region.
(a–f) MN somata (encircled in (a) and (d)) showing C-bouton synapses immunostained for simultaneous visualisation of M2 AChR (green), SR1 (red) and VAChT (blue); an enlargement of the square delimited C-bouton is shown in (b,c,e,f) in either separate or combined channels; note the similar distribution of the M2 AChR and VAChT sites; this contrasts with the differential localisation of M2 AChR and SR1; two channel merged images are shown in (a,d,e and f). (g,h) Sites containing S1R locate in a central region surrounded by NRG1-positive patches, separately delimited from presynaptic VAChT. (h) Volume rendering of a C-bouton site showing the differential distribution of NRG1 (green) and S1R (red) is depicted. (j–o) Clusters of NRG1 (green) and Kv2.1 (red) display a complementary distribution within the VAChT-positive (blue) C-bouton; two and three channel merged images are shown in (m,n) and (o), respectively. (p) A detail of a C-bouton, double labelled for NRG1 (green) and Kv2.1 (red), is subjected to pixel profile analysis along the depicted line; note the absence of colocalisation between the two interdigitating signals. (q–s) Surface of squashed MN cell body (delimited by a dotted line) displaying the distribution of clustered Kv2.1 (red) potassium channels in VAChT-immunolabelled C-boutons (blue) (q); the lateral and orthogonal projections of enlarged C-boutons are shown in (r) and (s), respectively; the postsynaptic localisation of Kv2.1 channels is shown in front of a VAChT-positive terminal in (r); the belt like arrangement of Kv2.1 potassium channels around the VAChT-labelled C-bouton can be seen in (s). (t–y) A triple immunolabelled C-bouton showing the differential distribution of SK3 Ca2+-dependent K+ (green) with respect to Kv2.1 K+ (red) channels in a VAChT-delimited (blue) synaptic region; two and three channel merged images are shown in (w,x), and (y) respectively. Scale bars: in (d) = 10 μm (also applicable to (a)); in (h) (valid for (g)), (i), (o), (p), (s) (valid for (r)) and (y) = 1 μm; in (q) = 20 μm.

