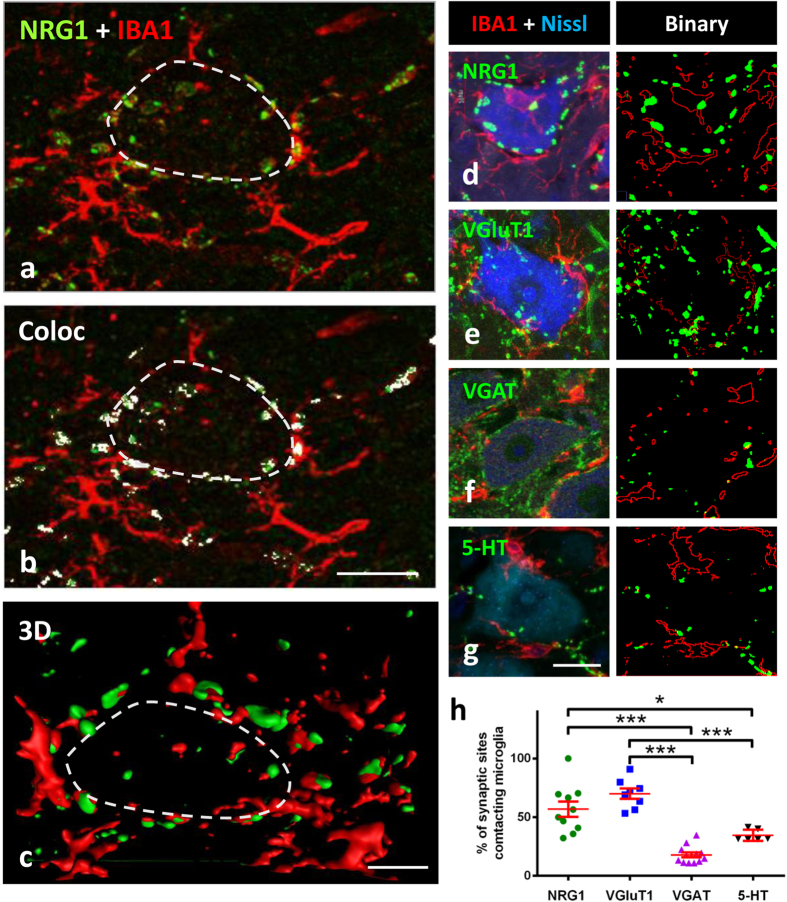
Figure 9. Recruitment of microglial cells to axotomised MNs exhibits apparent positive chemoattraction to C-bouton sites.
(a) IBA1 positive microglial profiles (red) near the soma of a 24 h axotomised MN show a high number of contacts with NRG1 positive C-bouton sites (green). (b) After colocalisation analysis, NRG1 clusters enwrapped by microglia are displayed in white. (c) 3D volume rendering showing the relationship between microglial processes and NRG1 clusters in the MN displayed in (a); the limit of MN soma is delineated (dashed lines). (d–g) The spatial relationship between microglial profiles and different afferent boutons on 7-day axotomised MNs is analysed after immunostaining for IBA1 (red) and the indicated synaptic proteins (green); MN somata were identified by Nissl staining (blue). The green and red signals were binarised for analysis as shown in each adjacent panel. (h) Graph showing that microglial profiles exhibit a preference to contact NRG1-labelled C-boutons and/or VGluT1-containing synapses, rather than to VGAT-immunolabelled GABAergic or serotoninergic (5-HT) synapses; plotted data are also shown as mean ± SEM; *p < 0.05, ***p < 0.001, one-way analysis of variance (Bonferroni’s post-hoc test). Scale bars: in (b) = 20 μm (valid for (a)); in (c) = 5 μm; in (g) = 20 μm (valid for (d,e,f)).

