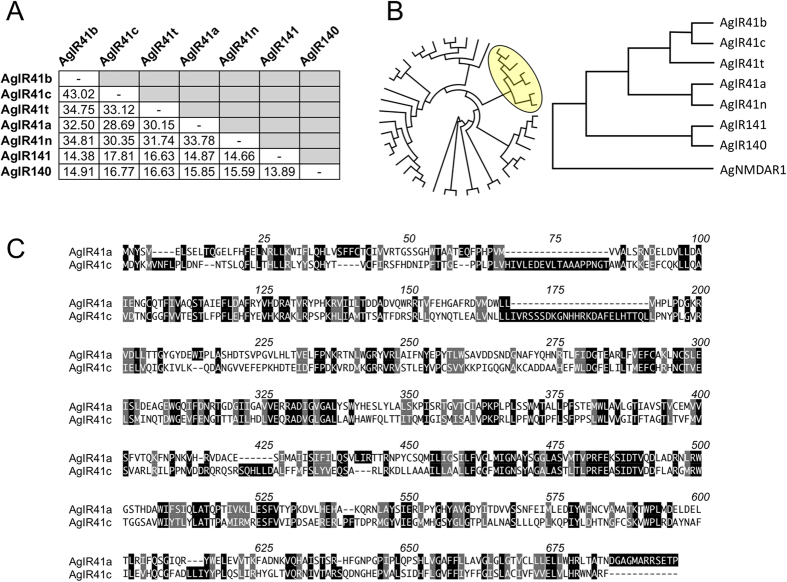
Figure 3. Phylogenetic relationships among AgIR41-related receptors.
(A) Pairwise amino acid percent identity matrix. (B) Cladograms based on sequence alignments of all AgIRs (circular cladogram) with AgIR41 clade (yellow circle) shown using the N-Methyl-D-Aspartate Receptor 1 (AgNMDAR1) as an outgroup. (C) Alignment of AgIR41a and AgIR41c amino acid sequences using the single letter code. Identical residues are indicated with black boxes over white text. Similar residues are shaded with gray boxes. Numbering indicates aligned positions, including gaps.

