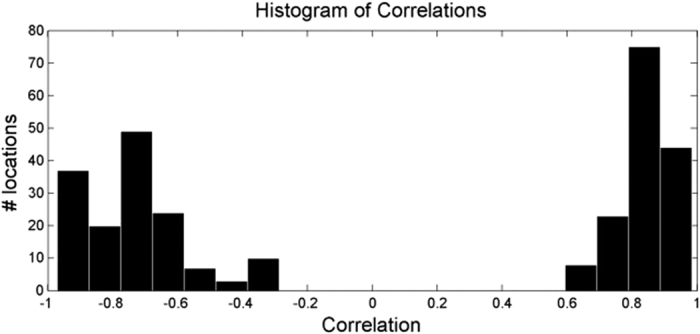
Figure 1. Histogram of the strongest signal correlation values relative to ground truth arterial waveform across all participants (n = 24).

The distribution is strongly bimodal, indicating one group of signals that are highly correlated with the arterial waveform, and another group that is strongly negatively correlated with the arterial waveform.
