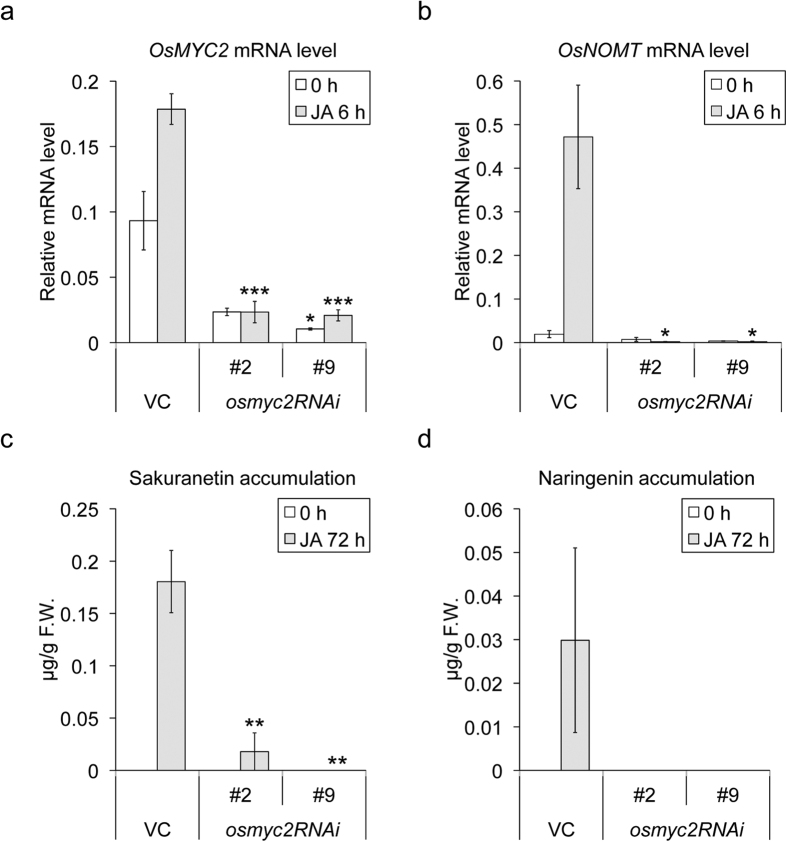
Figure 2. Gene expression and phytoalexin accumulation in the OsMYC2-knockdown plants (osmyc2RNAi).
(a,b) Expression levels of OsMYC2 (a) and OsNOMT (b). Total RNA from the rice leaves after 6 h of 500 μM JA treatment (grey bars) or untreated rice leaves (open bars) was extracted. qRT-PCR analysis was performed using the cDNA samples synthesized from the total RNA. (c,d) Contents of sakuranetin (c) and naringenin (d) in the rice leaves after 6 h of 500 μM JA treatment (grey bars) or no treatment (open bars). Data are presented as mean ± standard error values. (a,b) n = 3–4, (c,d) n = 4–6. *P < 0.05, **P < 0.01, ***P < 0.001, compared to the VC data for each treatment.

