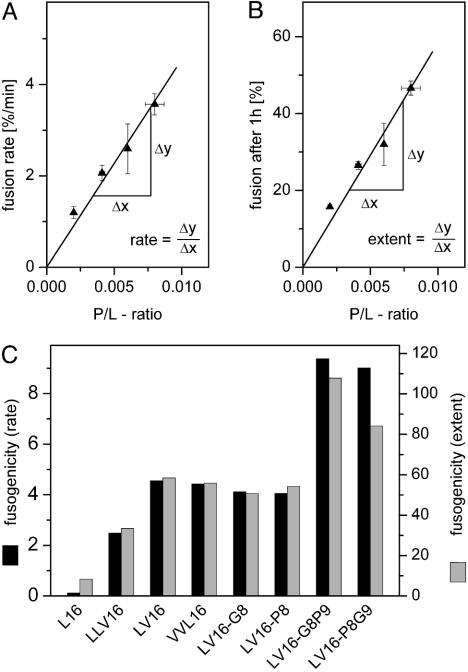
Fig. 3.
Comparison of fusogenicities. (A) Taking LV16 as an example, the schematic depicts how the slopes of the relationships between P/L ratio and initial fusion rate (Left) or fusion extent (Right) were derived for the comparison shown in B. V16 was omitted here because of its inefficient membrane incorporation.

