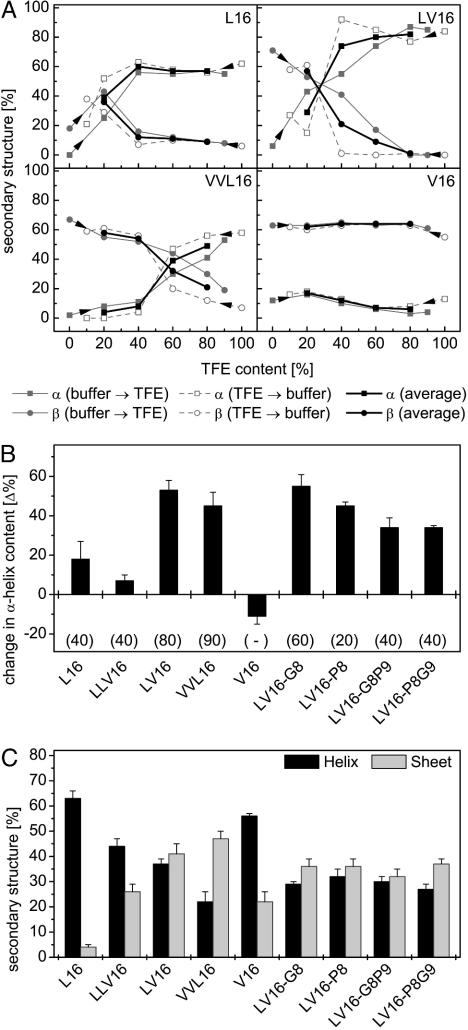
Fig. 4.
Structural plasticity of LV peptides determined by CD spectroscopy. (A) Contents of α-helical and β-sheet structure are shown for some peptides (0.1 mg/ml) upon titrating from either aqueous buffer or from TFE solution as indicated by arrowheads. Bold lines represent the averaged values of both types of titrations. (B) Conformational change of peptides as revealed by differences in average helix content seen at 20% and 80% TFE, respectively. Gains in secondary structure upon decreasing polarity result in positive values. Note that the change in helix content tended to be larger with the more fusogenic peptides. Data are shown as means ± SE (n = 4–5). (C) Contents of α-helical and β-sheet structure in inverse sodium bis(2-ethylhexyl)sulfosuccinate/water/iso-octane micelles. Data are shown as means ± SE (n = 8–10).

