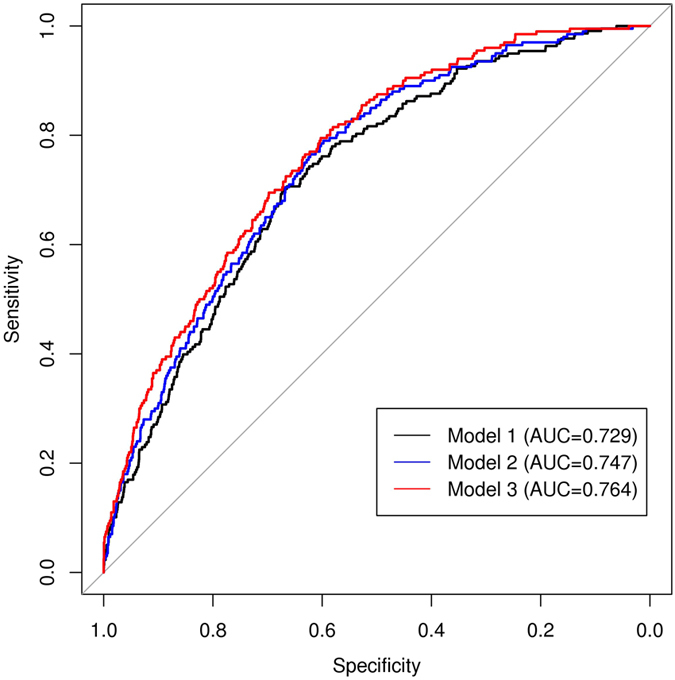
Figure 2. Receiver operating characteristic (ROC) curves of three models to predict incident AF.

Model 1: Only included traditional risk factors; Model 2: Included traditional risk factors and 14 AF-related genetic loci; Model 3: Included traditional risk factors, 14 AF-related genetic loci, and 5 AF-related CpG sites. The inclusion of genetic loci and methylation profiles modestly improved the prediction performance with area under curve (AUC) increasing from 0.729 (model 1) to 0.747 (model 2) and 0.764 (model 3).
