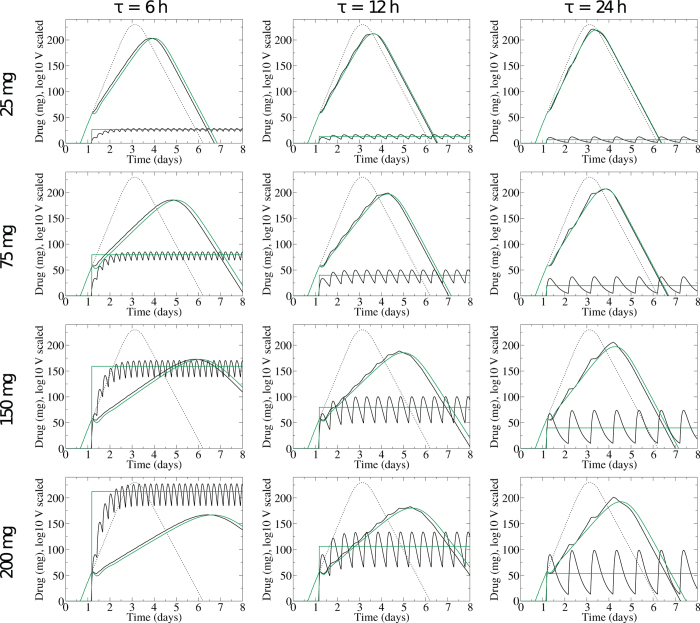
Figure 4. Viral titers and drug concentrations for infections treated with time-varying drug D(t) from Eq. 4 (black lines), and the viral titers and drug concentrations for infections treated with a constant drug concentration approximation from Eq. 1 and ton = tadmin.
The dashed line shows the untreated infection.

