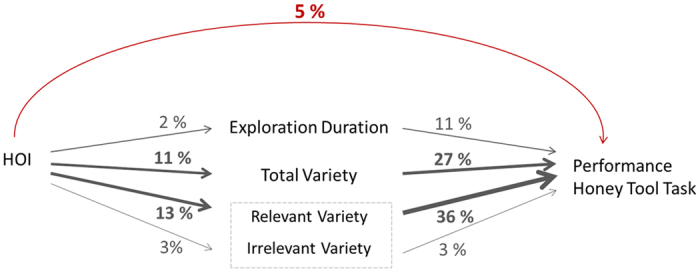
Figure 4. Graphical illustration of the relationship between the human orientation Index (HOI), the cognitive performance and exploration duration and variety, in context to each other.

The total variety can be divided into relevant and irrelevant variety. The figure also indicates the percentage of variation estimated by the pseudo R2 for linear mixed effects margins that is explained by each factor. The thickness of the arrows accentuates the strength of the influence.
